Thursday, 15 March 2007

Viewshed calculations HeyWhatsThat, Dull and XML editors

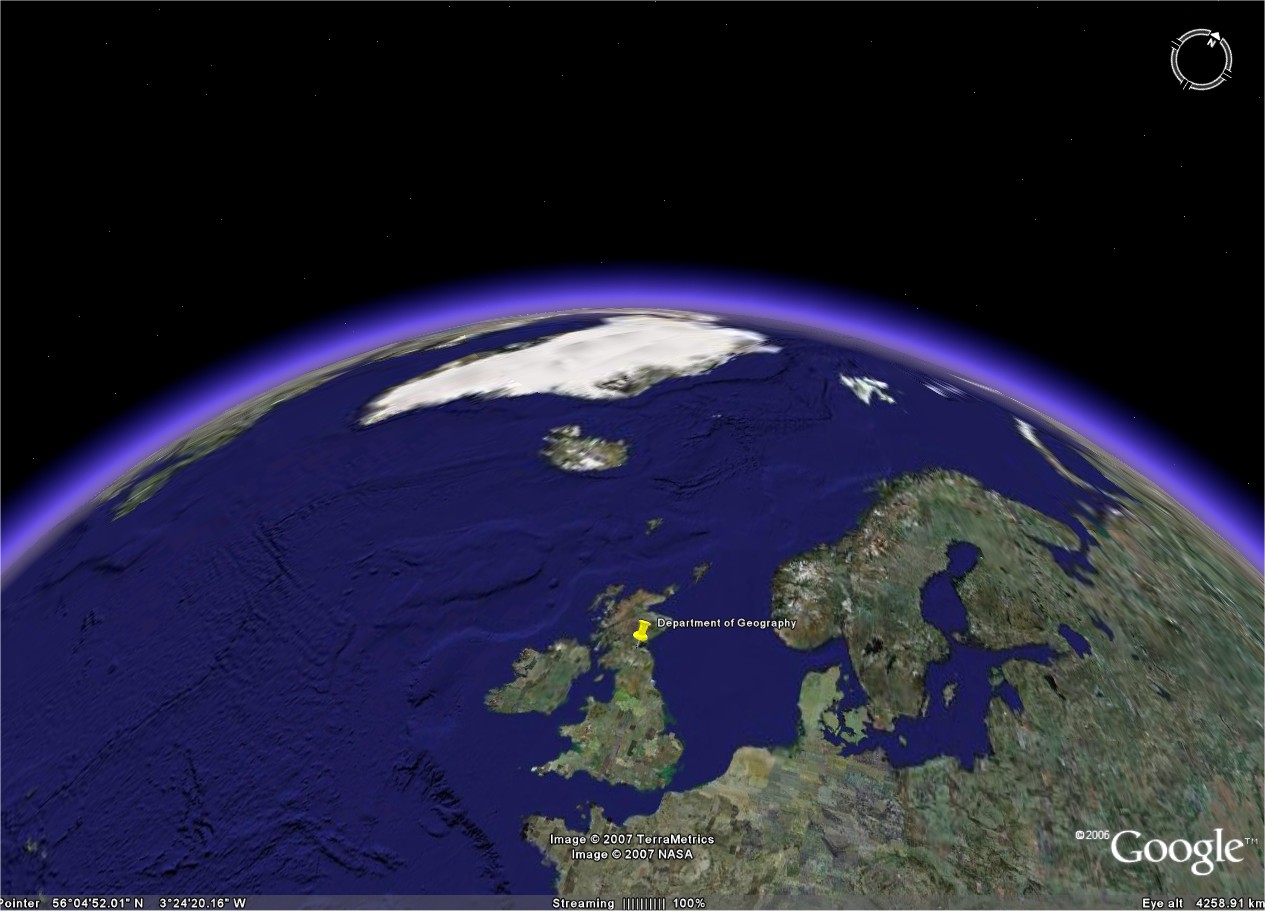
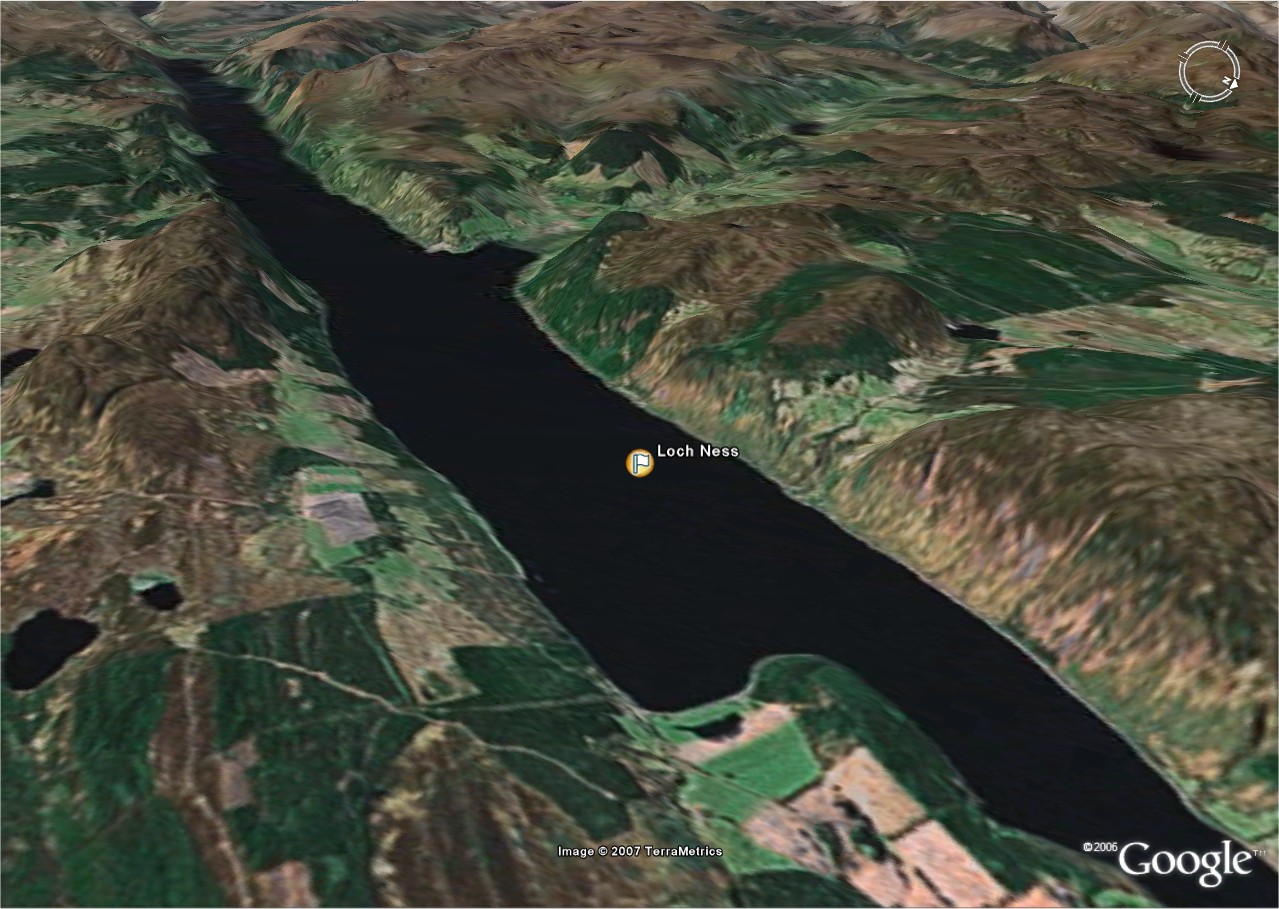
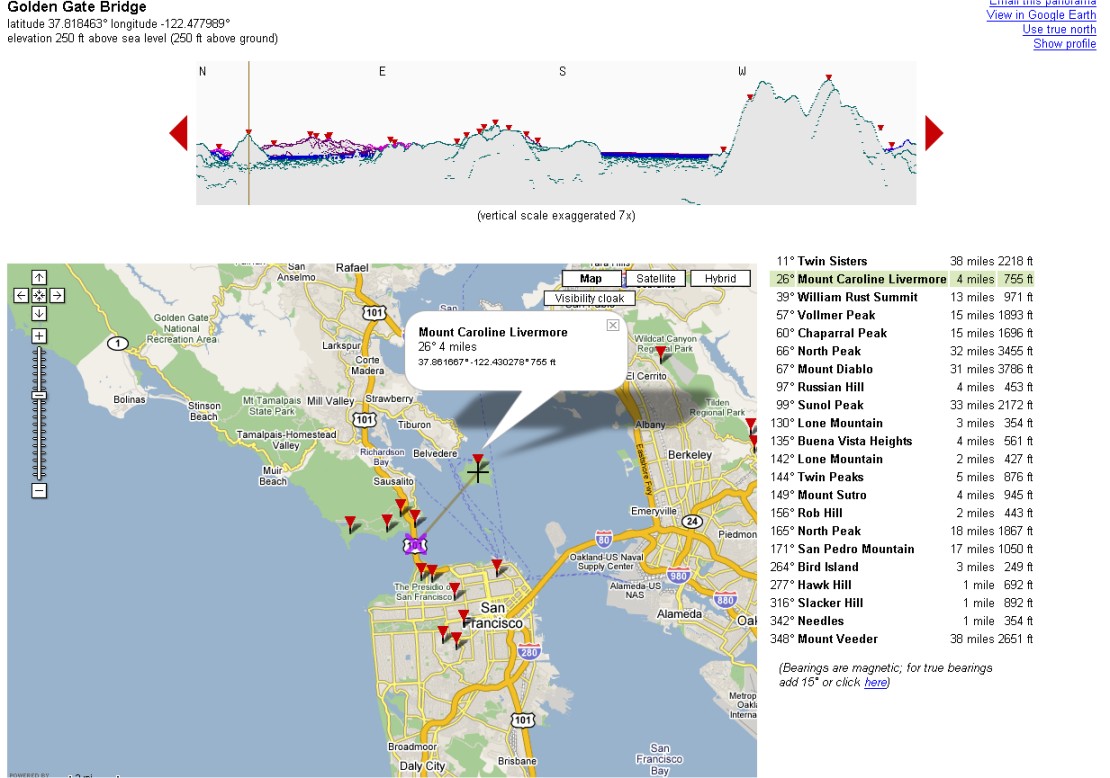
Ogle Earth finds another gem in the form of HeyWhatsThat.com, which uses the SRTM data that is available with GE, to perform viewshed calculations. It can output directly to Google Maps, where it draws a 360 degree panorama that interacts with the google map interface. It also identifies the peaks visible from your position, and you can highlight the entire viewshed in red.

You can also import the entire set into Google Earth, to, I suppose test if the algorithm is correct. Very very cool.

Another useful thing I saw related to education, was a post on slashgeo.org concerning the use of Skype to control virtual globes on another computer. Unype allows two (or more?) users to interact with each others globe, showing them around, and so on. GE Blog reviews and also has a video.

But anyway, after having criticised the Gazetteer for Scotland in an earlier post, I suppose I had better make amends! I was of course referring to the village of Dull in Perth and Kinross. *cough*

I did some work getting XLST to work today, with limited success. I did after hacking up a quick XML sample of one of the Gazetteers pages, manage to reproduce a html document with some images from that XML source using XLST. The plan is to produce some samples for use in my presentation on Monday, perhaps an html document with two seperate stylesheets, and maybe KML, to demonstrate how powerful XSLT can be.

The only major problem I've had is in my search for a good editor. I decided to start off simple with Microsoft's XML Notepad 2007 . At first glance it did exactly what I wanted it for, but it has some really annoying bugs, especially that you need to close and re-open the XSLT stylesheet everytime you want to re-transform (the copy must be cached inside). So that was useless.

I then tried Oxygen. This was complete at the other end of the scale. Not only do I just get a 30 day trial, but it's also so incredibly complex with so much functionality that I really don't need. Having said that, it worked quite nicely if you ignore _all_ the functions and just use it as an editor, and as a tool for running the XSLT.

Anyone have better suggestions?

Labels: , , , , ,

Sunday, 11 March 2007

Google Lit Trips, Meteox, and the beautiful Alps

Just as was trying to explain how virtual globes can lead narratives, Ogle Earth links to GoogleLitTrips.org, a really nice example of how we can use visualisations to aid within wider education, in this case renowned literary works.

Then my dad pointed me towards meteox.co.uk which despite the URL seems to be a Dutch site that uses both google and geodan maps to display rainfall (radar) across europe. It also does the (now) obligatory Google Earth KMZ link for all the data, though while it updates hourly, it doesn't allow for time-led animations in the same way the maps do.

meteox screenshot

Finally, I never wrote about it, but various sources reported the huge update to Google Earth and especially the Swiss Alps. Some of the new imagery draped over the elevation data reproduces some of the stunning scenery. Now, just to have the time and the money to head in search of the snow!

alps

While I was exploring, anyone know what kind of rock turned up red and blue on the imagery though?

red rocks

Oh and some final quick links for reference:
- Ogle Earth and KML editors
- Earth is square on MapleCroft Maps

Labels: , , ,

Friday, 9 March 2007

Dissertation idea request? Virtual globes and education.

I've cross-posted this a bit, and it's related to my dissertation. Feedback really apreciated, especially from those who aren't ordinarily my blog readers :)


Hi everyone,

I promised I'd complete this over the weekend - typically it ran over into this week, and I've only just managed to send it out now. Apologies. If you don't have time to look at this, or give feedback, then please don't worry.

For those of you that don't know my background, I'm currently undertaken a Masters of Science in Geographical Information Science (GIS) in Edinburgh. GIS very roughly is about how we can use technology to represent geographical information. Anyway, as part of my masters I need to produce a dissertation. Read on :)

The website is called The Gazetteer for Scotland - feel free to take a quick look. As you can see, it's quite dull, but does contain a vast amount of information on all kinds of things to do with Scotland.

This is an encyclopedic website run by a few staff members and the Royal Scottish Geographical Society, and it is my job to translate this website in such a way that it can be used within education. I won't bore you with the technical details, but I propose to use something like Google Earth as a platform to represent the data that currently is on the website, and tailor it to aid teaching.

Why a virtual globe such as Google Earth? Well, traditional web-sites are becoming fairly boring, especially when set up in Gazetteer fashion - especially to kids. A tool such as Google Earth is an easy to use and interesting way of engaging an audience, and allows data to be represented at different dimensions within space and time.

ge1 screen
How exactly is where I need some help and suggestions. I know what I can do from a technical perspective, but I'm not really too sure how this all fits into practice. If you can help me with a few of these questions, I would be most grateful. Of course, other comments, suggestions and issues are welcome.

- What sort of age-group, ability level do you think I could target something like this at?
- What kind of information is interesting, or relevant? What kind of theme do you think would be interesting to develop?
- How would a demonstration work in practice with respect to certain age groups? Should you demonstrate, or provide laboratory sessions?

ge2 screen

Clearly content is related to the age, and the age and ability level will dictate whether this is an effective tool.

Some ideas I have already:

- Creating a historical narrative, that leads you around areas of Scotland through time.
- Quiz/ Fact-Finding tutorial allowing them to explore Scotland and the Gazetteer data set.

Can you help? Please PM me back, leave comments, or email me :)
--email address removed--


I've used Google Earth as the example, though I will probably use World Wind. I'm starting work on the content very soon - so should have something to show in the very near future.

Labels: , , ,

Saturday, 24 February 2007

Voronoi and end of week update

It's Saturday at last! A rather hectic week has past with this tricky paper on KML finally handed in. I attempted to cover coordinate transformations between different projections, and how KML might handle such an issue.

I managed to cover enough luckily without having to delve into some of the complex equations that you need to use. My main point, is that rather than have the client (GE etc.) interpret different notations of coordinate tags, which is probably unlikely, it may be possible to build these complex transformations into the XSLT that you would use to transform your XML data source into KML...?

Now I've just to do a small essay on using Virtual Worlds to aid teaching, a small exploratory data analysis exercise..and I'm finally done with courses and can focus on my dissertation.

Before heading out last night and consuming a few too many beers, I went to the Edinburgh Earth Observatory/AGI weekly seminar, which this week featured Chris Gold, EU Marie Curie chair at Glamorgan University and Voronoi Evangelist!. For such a potentially dry subject, focussing on algorithms, he made it remarkeably interesting, and is an excellent speaker. For those interested, Glamorgan University is hosting the Fourth Annual Symposium on Voronoi Diagrams

Finally, related to my dissertation, Earth is square links to an excellent article about using WW in the classroom.

Labels: , , ,

Tuesday, 23 January 2007

Google and Microsoft take to the skies for Australia Day

The Earth is square blog highlights an interesting google maps implementation. I suppose I never really thought about the fact that your data source need not be maps, or aerial imagery, but could be anything really.. This one: Google World Domination!

Also from this very interesting blog, was a write-up of his experiences at the Digital Globe Conference. He has posted the presentation he used, and might be an interesting contact when it comes to considering my GE/WW/whatever else remake of the Gaz data.

The other interesting piece of information I found on the GE Blog was some competition between Microsoft and Google during Australia Day 2007. Having been in Sydney for Australia day last year.. it's pretty cool that both these big companies are using this as a publicity stunt, that should create some great imagery. As reported by the Sydney Morning Herald The Microsoft Virtual Earth blog also reports that they have created a special map showing Australia Day events right across Australia.

-EDIT - There was a huge Virtual Earth update a few days ago, covering some fantastic European Cities. You'll need to install the plugin though.

Labels: , , ,